> ## Documentation Index
> Fetch the complete documentation index at: https://docs.promo.cv/llms.txt
> Use this file to discover all available pages before exploring further.
# Dashboard
> Your agency dashboard gives you a quick snapshot of your activations, applicants, roster, and engagement.
Your dashboard is the first thing you see when you log in. It gives you a high-level overview of your agency's activity at a glance.
 ## Stats overview
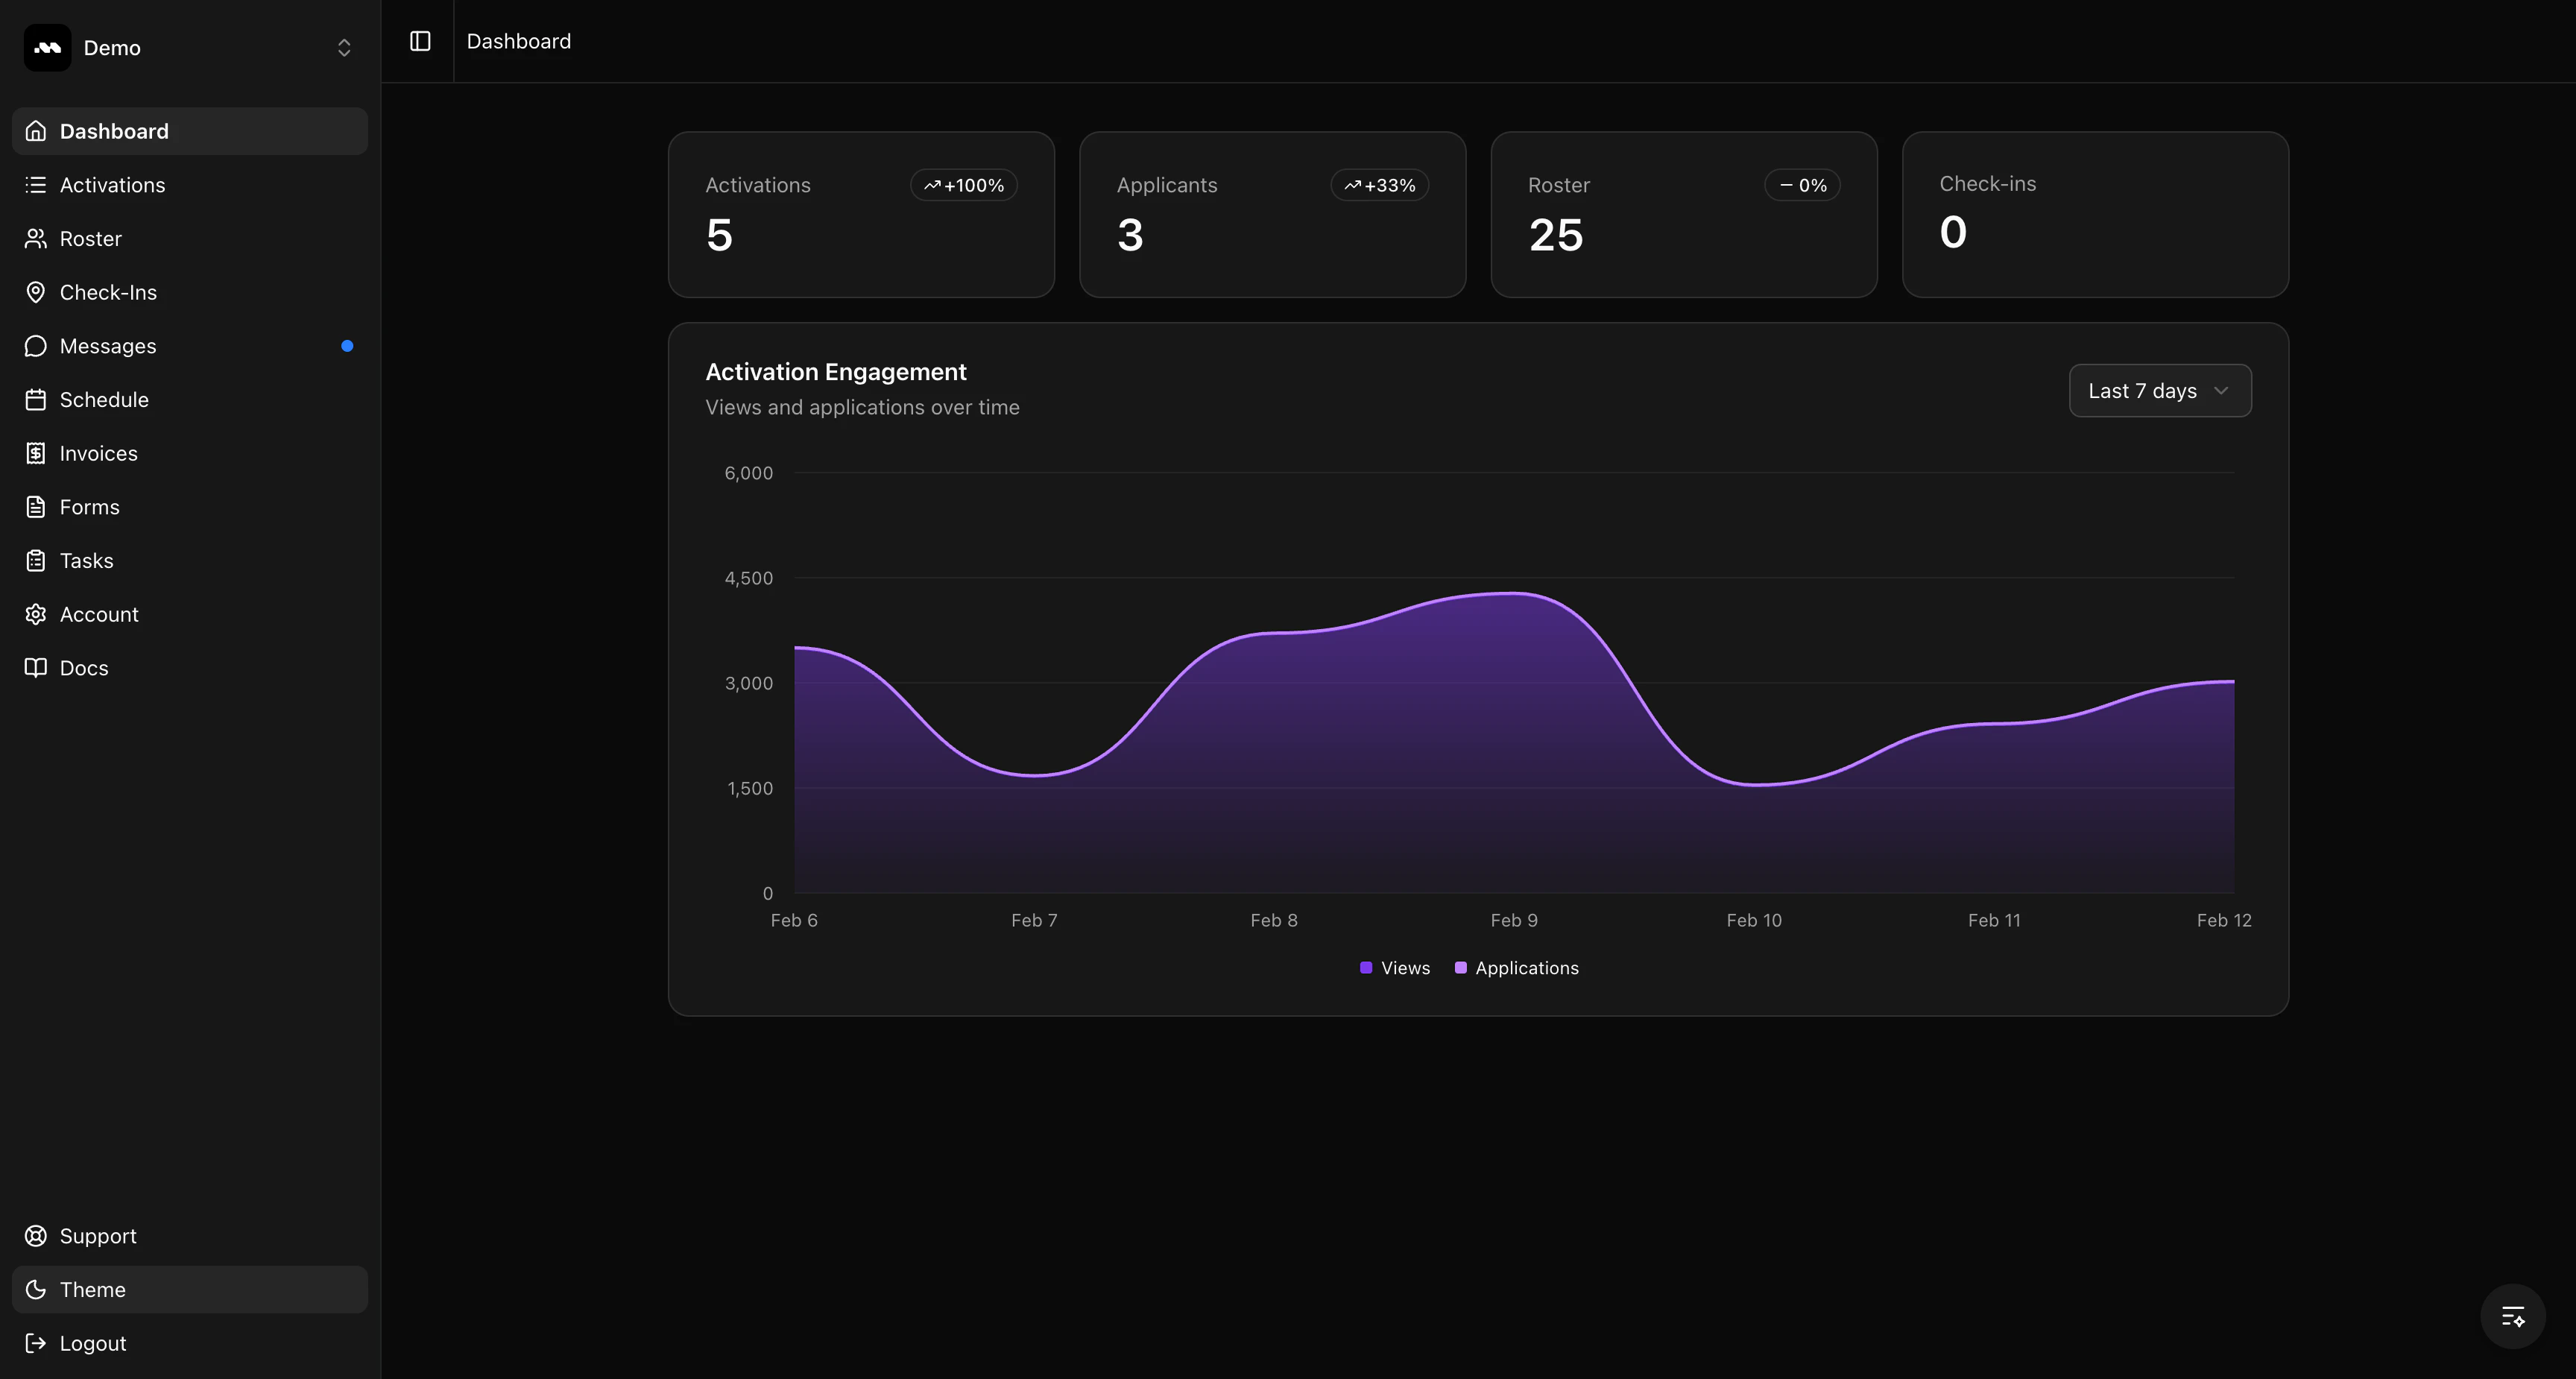
The four cards at the top of the dashboard show your key metrics:
* **Activations** — The number of published activations currently live. Click to view your activations list.
* **Applicants** — Pending applications waiting for your review.
* **Roster** — Total brand ambassadors on your roster. Click to view your full roster.
* **Check-ins** — Total check-ins recorded across your activations. Click to view check-in details.
Each card may show a **growth badge** (e.g. +100%, +33%) indicating how that metric has changed in the last 24 hours compared to the previous day.
## Activation Engagement chart
Below the stats, the **Activation Engagement** chart shows how your activations are performing over time with two metrics:
* **Views** — How many times your activation listings have been viewed.
* **Applications** — How many applications have been submitted.
Use the dropdown in the top-right corner of the chart to switch between **Last 24 hours** and **Last 7 days**.
## Stats overview
The four cards at the top of the dashboard show your key metrics:
* **Activations** — The number of published activations currently live. Click to view your activations list.
* **Applicants** — Pending applications waiting for your review.
* **Roster** — Total brand ambassadors on your roster. Click to view your full roster.
* **Check-ins** — Total check-ins recorded across your activations. Click to view check-in details.
Each card may show a **growth badge** (e.g. +100%, +33%) indicating how that metric has changed in the last 24 hours compared to the previous day.
## Activation Engagement chart
Below the stats, the **Activation Engagement** chart shows how your activations are performing over time with two metrics:
* **Views** — How many times your activation listings have been viewed.
* **Applications** — How many applications have been submitted.
Use the dropdown in the top-right corner of the chart to switch between **Last 24 hours** and **Last 7 days**.