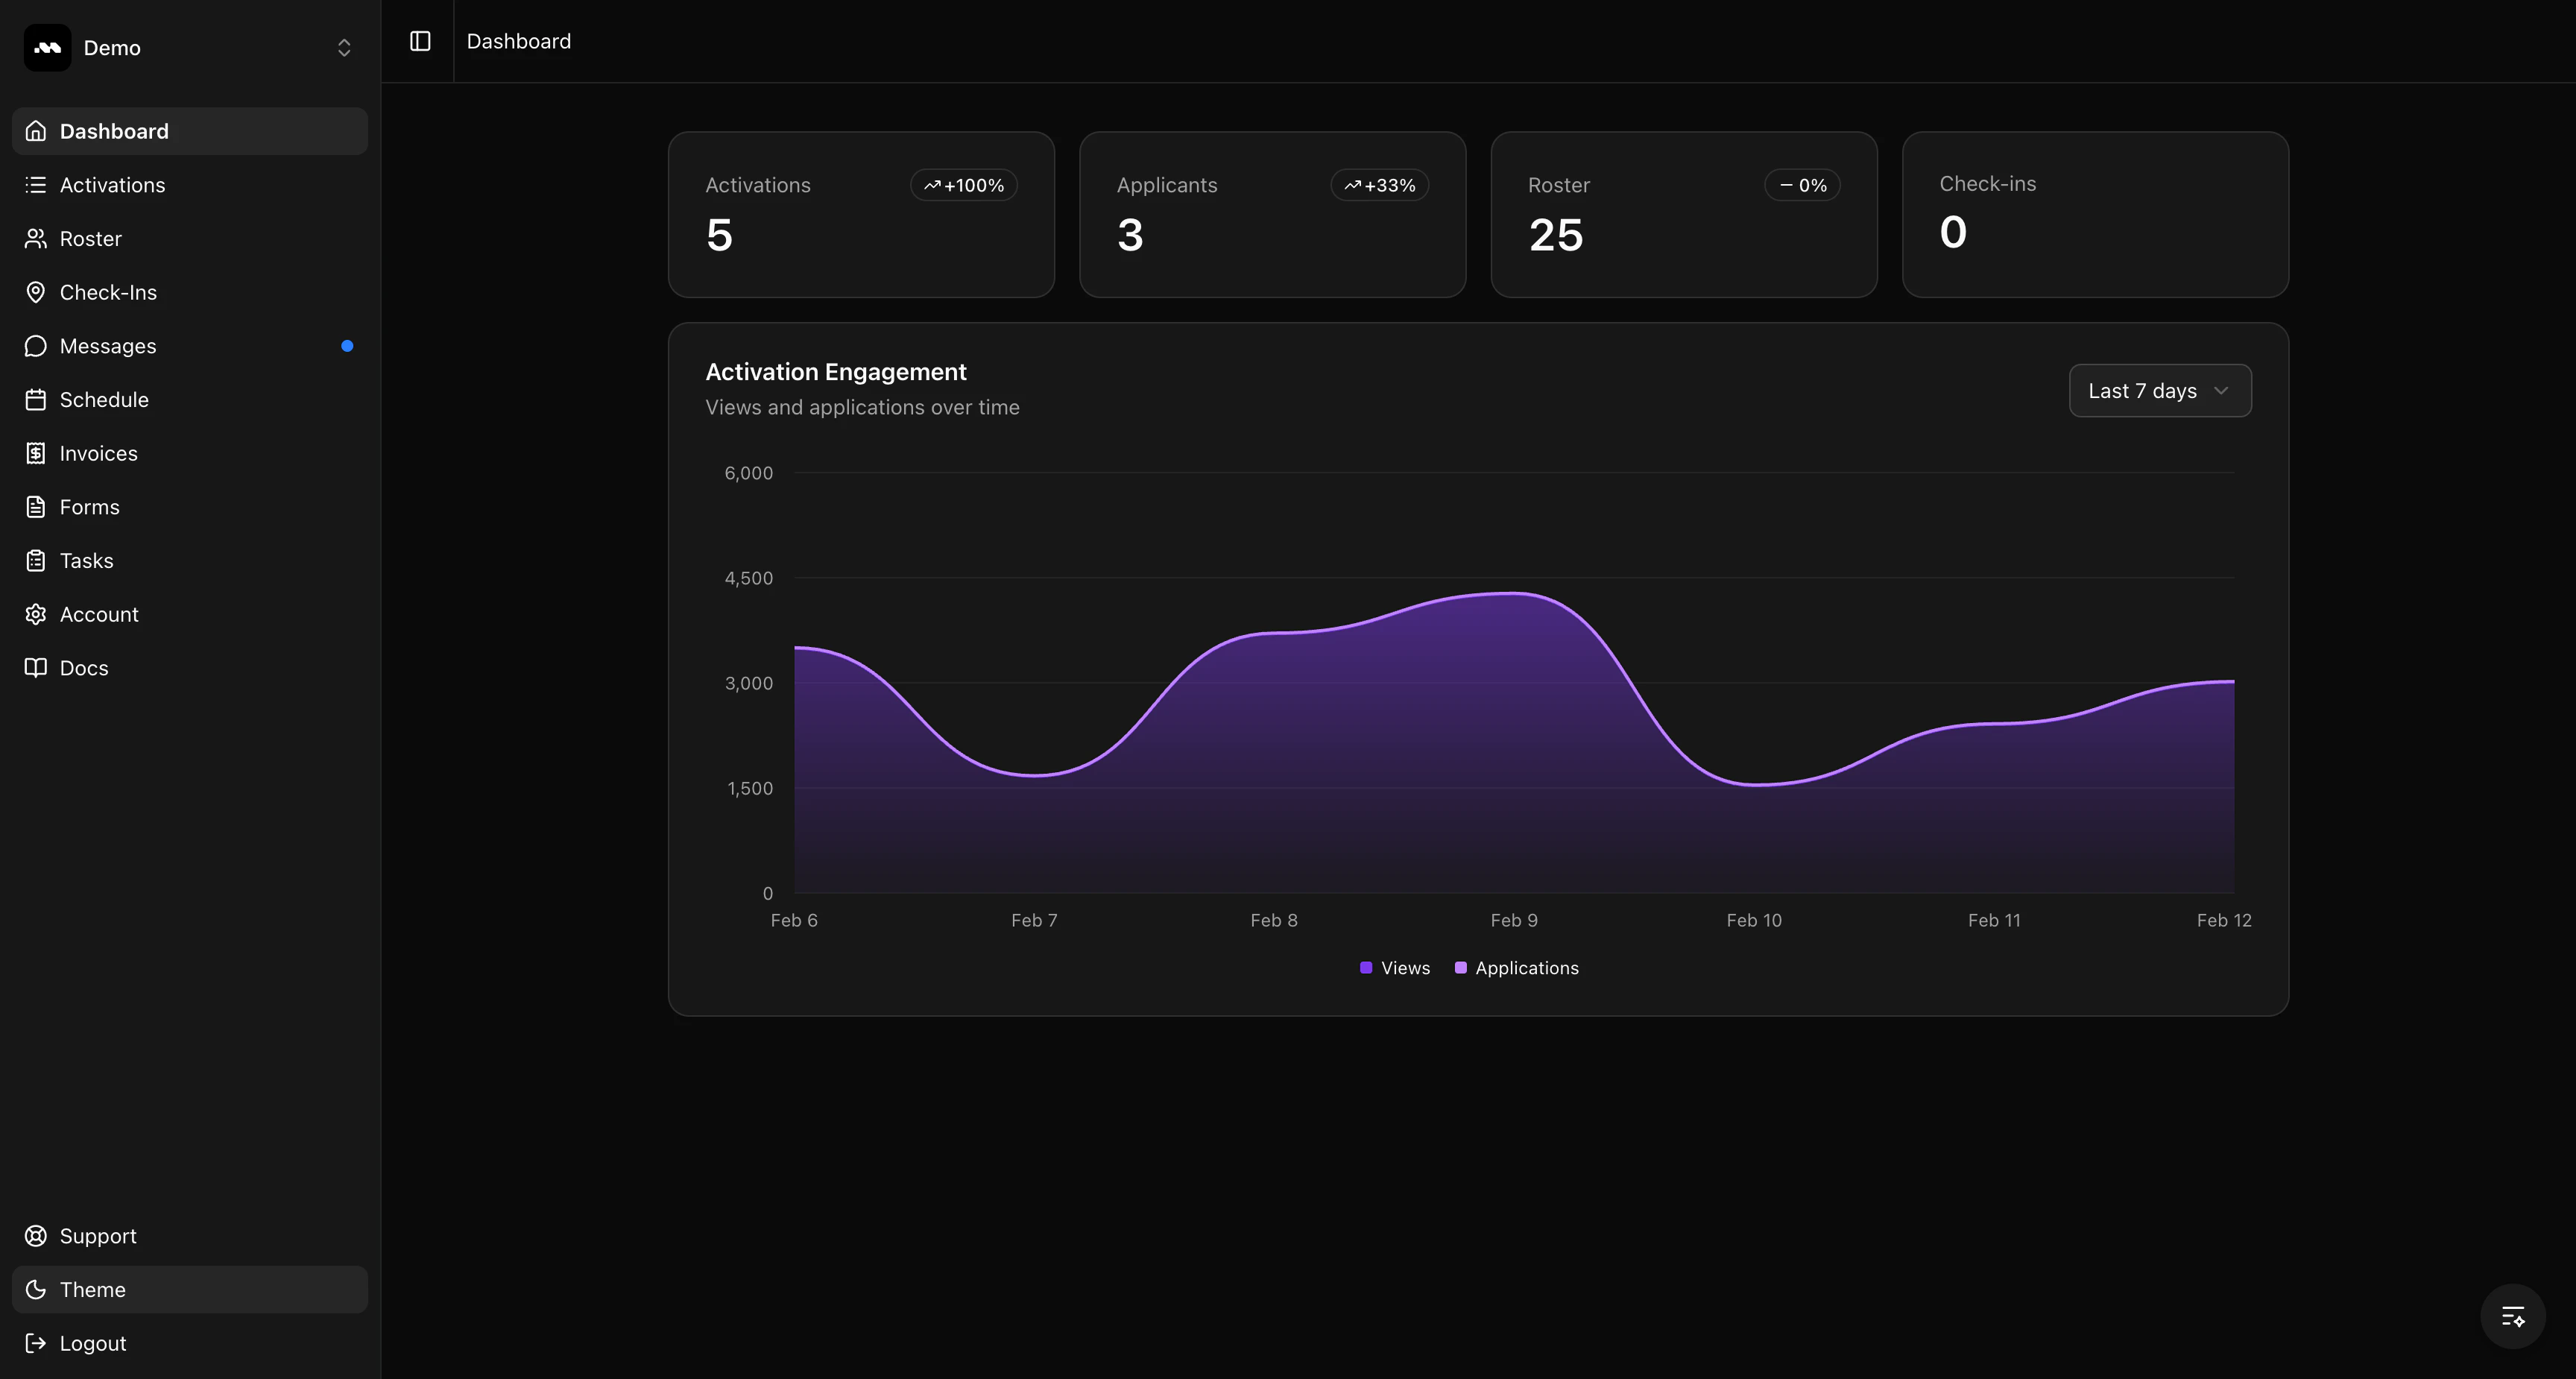
Stats overview
The four cards at the top of the dashboard show your key metrics:- Activations — The number of published activations currently live. Click to view your activations list.
- Applicants — Pending applications waiting for your review.
- Roster — Total brand ambassadors on your roster. Click to view your full roster.
- Check-ins — Total check-ins recorded across your activations. Click to view check-in details.
Activation Engagement chart
Below the stats, the Activation Engagement chart shows how your activations are performing over time with two metrics:- Views — How many times your activation listings have been viewed.
- Applications — How many applications have been submitted.